★★ 2-Star Battery Data#
This notebook demonstrates how to process raw battery cycler data into a structured, machine-readable tabular format. This corresponds to the second star in the Five-Star Battery Data framework.
What does two-star mean?#
In the 5-Star Battery Data framework, 2-star data is:
Structured — each row represents one observation, and each column represents one variable.
Machine-readable — stored in formats like CSV or Parquet that software tools can easily parse.
Clearly labeled — with SI-compliant names and units (e.g.,
Voltage / V, notVoltage (V)).Standardized — follows community conventions such as the Battery Data Format (BDF).
This notebook helps you transform messy or proprietary outputs into clean, standardized tables that are ready for analysis, publication, and reuse.
Watch#
Why is this important?#
Raw battery data is often inconsistent or difficult to process, which hinders reuse. By transforming it into a standardized, structured table:
It becomes easier to index, search, filter, and visualize.
It can be reliably used by humans and machines alike.
It aligns with FAIR data principles and sets the stage for semantic enrichment in 3-star and 4-star datasets.
What we will do#
In this notebook, we will:
Read the raw cycler data file
Process it to align with the BDF standard by:
Renaming columns using consistent, SI-style labels
Converting timestamps to UNIX time
Ensuring consistent units
Visualize the cleaned time-series data
Serialize it to a BDF-compliant CSV format
This is an essential step toward making your data FAIR and ready for semantic annotation in the next stars.
1. Read the cycler data file#
In this step, we read the csv data file that has been exported from the cycler into a pandas dataframe and explore its content.
ℹ️ Note on file formats
Cycler hardware often exports data files in a proprietary binary format. It is important for broader usability that this is converted into an open data format (e.g. csv, txt, parquet, etc.) as soon as possible to avoid proprietary software dependencies.
[1]:
# Import python package dependencies
import pandas as pd
import numpy as np
import matplotlib.pyplot as plt
import pytz

# Load raw data from the parent directory
file_name = 'raw_data_output_from_cycler.csv'
raw_data = pd.read_csv(file_name)
raw_data.head()
[1]:
| DataPoint | Cycle Index | Step Index | Step Type | Time(s) | Total Time(s) | Current(A) | Voltage(V) | Capacity(Ah) | Spec. Cap.(mAh/g) | ... | Contact resistance(mO) | Module start-stop switch | SOC/DOD(%) | LgD | V1(V) | V2(V) | V3(V) | T1(?) | T2(?) | T3(?) | |
|---|---|---|---|---|---|---|---|---|---|---|---|---|---|---|---|---|---|---|---|---|---|
| 0 | 1 | 1 | 1 | Rest | 0.00 | 0.00 | 0.0 | 3.8022 | 0.0 | 0.0 | ... | 0.0 | Close | 0.0 | NaN | 0.0 | 0.0 | 0.0002 | 26.2 | 26.2 | 26.4 |
| 1 | 2 | 1 | 1 | Rest | 0.01 | 0.01 | 0.0 | 3.8022 | 0.0 | 0.0 | ... | 0.0 | Close | 0.0 | NaN | 0.0 | 0.0 | 0.0002 | 26.2 | 26.2 | 26.4 |
| 2 | 3 | 1 | 1 | Rest | 10.00 | 10.00 | 0.0 | 3.8022 | 0.0 | 0.0 | ... | 0.0 | Close | 0.0 | NaN | 0.0 | 0.0 | 0.0003 | 26.2 | 26.2 | 26.4 |
| 3 | 4 | 1 | 1 | Rest | 20.00 | 20.00 | 0.0 | 3.8022 | 0.0 | 0.0 | ... | 0.0 | Close | 0.0 | NaN | 0.0 | 0.0 | 0.0002 | 26.2 | 26.2 | 26.4 |
| 4 | 5 | 1 | 1 | Rest | 30.00 | 30.00 | 0.0 | 3.8022 | 0.0 | 0.0 | ... | 0.0 | Close | 0.0 | NaN | 0.0 | 0.0 | 0.0002 | 26.0 | 26.2 | 26.4 |
5 rows × 34 columns
The raw data contains 34 columns, corresponding to a variety of properties. We will now process it into a community standard format to support broader re-use and interoperability.
Process the data to align with the BDF standard#
The Battery Data Format (BDF) is an open community standard for structuring battery test data in a clear, consistent, and machine-readable way. It defines how to name fields, express units, and organize data so it can be reliably processed, interpreted, and shared across research and industry. By aligning with BDF, we ensure this dataset is easy to work with using both automated tools and human-readable analysis.
The raw data contains many quantities that are redundant or can be derived from other fundamental quantities. For BDF conversion, we take only the core subset of measured quantities. It is important to balance the need for archiving complete information with the desire to reduce file size by removing redundant quantities. The BDF defines a minimum set of required quantities, along with a broader set of recommended and optional quantities. It is up to the data curator to determine how much detail is necessary.
Original Label |
BDF Preferred Label |
Description |
|---|---|---|
Total Time(s) |
Test Time / s |
Elapsed time since the start of the test, recorded in millisecond. |
Voltage(V) |
Voltage / V |
Instantaneous voltage measured across the test object, in volt. |
Current(A) |
Current / A |
Instantaneous current applied to or from the test object, in ampere. |
– (generated) |
Unix Time / s |
Timestamp of the measurement in Unix time (second since epoch). |
– (generated) |
Step Count / 1 |
Sequential index of the current step in the test program, increasing monotonically. |
T1(?) |
Temperature 1 / °C |
Measured temperature at sensor 1 on the test object, in degree Celsius. |
T2(?) |
Temperature 2 / °C |
Measured temperature at sensor 2 on the test object, in degree Celsius. |
T3(?) |
Temperature 3 / °C |
Measured temperature at sensor 3 on the test object, in degree Celsius. |
Now we will process the data from the raw file to align with BDF recommendations. More information on the BDF is available here.
ℹ️ Unit notation
The use of a forward slash (
/) to separate the variable name from the unit (e.g.,Voltage / V) follows recommendations from the International System of Units (SI) and IUPAC. This style reflects the algebraic nature of physical quantities, where each variable is the product of a numeric value and a unit. It improves clarity, avoids ambiguity in composite units, and aligns with standard scientific conventions in data labeling and dimensional analysis.
[2]:
# Extract total test time
test_time_s = np.maximum.accumulate(raw_data['Total Time(s)'])

# Extract temperatures
temperature_1 = raw_data['T1(?)'] if 'T1(?)' in raw_data else np.nan
temperature_2 = raw_data['T2(?)'] if 'T2(?)' in raw_data else np.nan
temperature_3 = raw_data['T3(?)'] if 'T3(?)' in raw_data else np.nan
ℹ️ Unix time
Unix time (also called epoch time or POSIX time) is a widely used standard for representing points in time. It counts the duration that has elapsed since 00:00:00 UTC on January 1, 1970. Using Unix time makes it easy to sort, compare, and align timestamps across different systems and time zones, making it ideal for machine-readable datasets and time-series analysis.
In the following block, we parse the string with the time-stamp to convert it to Unix time. The experiment was conducted in the CET timezone, which is first converted to UTC and then to Unix time.
[3]:
# Define CET (standard time only — no daylight savings)
cet = pytz.timezone('CET')  # Assumes winter time only (UTC+1, no DST correction)

# Parse and localize 'Date' to CET, then convert to UTC
df_datetime = pd.to_datetime(raw_data['Date'], format='%Y-%m-%d %H:%M:%S')
df_datetime = df_datetime.dt.tz_localize(cet).dt.tz_convert('UTC')

# Convert to Unix time in seconds
unix_time_s = df_datetime.astype('int64') / 1e9
Finally, the converted data with BDF compliant headers is compiled into a new dataframe.
[4]:
# Assemble the BDF-compliant DataFrame
bdf_data = pd.DataFrame({
    'Test Time / s': test_time_s,
    'Current / A': raw_data['Current(A)'],
    'Voltage / V': raw_data['Voltage(V)'],
    'Unix Time / s': unix_time_s,
    'Step Count / 1': raw_data['Step Index'],
    'Temperature 1 / °C': temperature_1,
    'Temperature 2 / °C': temperature_2,
    'Temperature 3 / °C': temperature_3
})
3. Visualize the data#
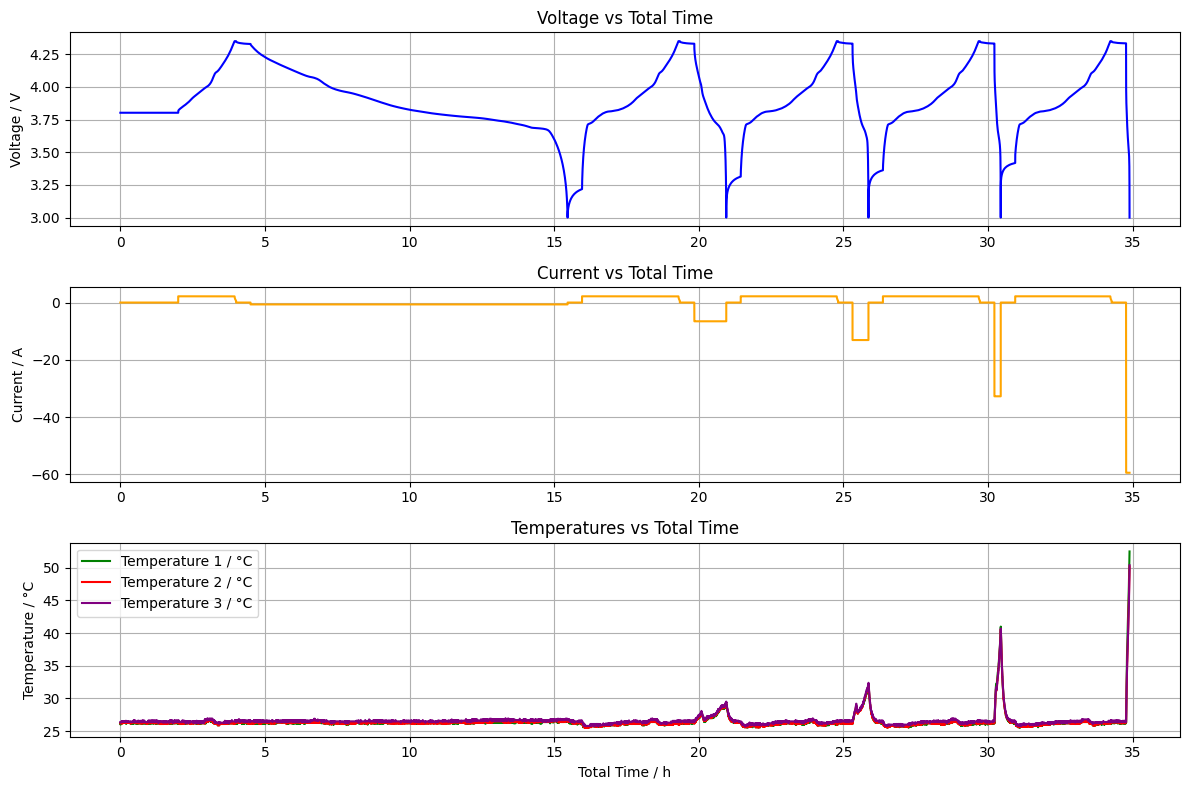
To verify data quality and provide insight into the test process, we visualize key quantities such as voltage, current, and temperature over time.
These plots help:
Detect anomalies or noise in the raw signal
Understand test conditions and dynamics
Confirm that the data has been correctly aligned and serialized
This step is especially important before sharing or analyzing the dataset further.
[5]:
# Plot Voltage, Current, and all Temperatures vs Total Time in one figure
time_h = bdf_data['Test Time / s'] / 3600

plt.figure(figsize=(12, 8))

# Voltage
plt.subplot(3, 1, 1)
plt.plot(time_h, bdf_data['Voltage / V'], label='Voltage / V', color='blue')
plt.ylabel('Voltage / V')
plt.title('Voltage vs Total Time')
plt.grid(True)

# Current
plt.subplot(3, 1, 2)
plt.plot(time_h, bdf_data['Current / A'], label='Current / A', color='orange')
plt.ylabel('Current / A')
plt.title('Current vs Total Time')
plt.grid(True)

# Temperatures (1, 2, 3)
plt.subplot(3, 1, 3)
plt.plot(time_h, bdf_data['Temperature 1 / °C'], label='Temperature 1 / °C', color='green')
plt.plot(time_h, bdf_data['Temperature 2 / °C'], label='Temperature 2 / °C', color='red')
plt.plot(time_h, bdf_data['Temperature 3 / °C'], label='Temperature 3 / °C', color='purple')
plt.xlabel('Total Time / h')
plt.ylabel('Temperature / °C')
plt.title('Temperatures vs Total Time')
plt.legend()
plt.grid(True)

plt.tight_layout()
plt.show()
Serialize the cleaned data to a BDF-compliant CSV#
The final step is to serialize the structured data into a CSV file that complies with the BDF standard.
This means:
The file uses BDF preferred column labels
The units adhere to BDF recommendations
All values are machine-readable and unambiguously defined
The output file can now be indexed, visualized, or combined with metadata and shared as part of a reproducible dataset.
structured_battery_data.bdf.csv
[6]:
# Save to CSV or display preview
bdf_data.to_csv("structured_battery_data.bdf.csv", index=False)
bdf_data.head()
[6]:
| Test Time / s | Current / A | Voltage / V | Unix Time / s | Step Count / 1 | Temperature 1 / °C | Temperature 2 / °C | Temperature 3 / °C | |
|---|---|---|---|---|---|---|---|---|
| 0 | 0.00 | 0.0 | 3.8022 | 1.729688e+09 | 1 | 26.2 | 26.2 | 26.4 |
| 1 | 0.01 | 0.0 | 3.8022 | 1.729688e+09 | 1 | 26.2 | 26.2 | 26.4 |
| 2 | 10.00 | 0.0 | 3.8022 | 1.729688e+09 | 1 | 26.2 | 26.2 | 26.4 |
| 3 | 20.00 | 0.0 | 3.8022 | 1.729688e+09 | 1 | 26.2 | 26.2 | 26.4 |
| 4 | 30.00 | 0.0 | 3.8022 | 1.729688e+09 | 1 | 26.0 | 26.2 | 26.4 |
Summary#
In this notebook, you learned how to transform raw battery cycler output into a clean, structured, and machine-readable dataset that meets the 2-star criteria in the Five-Star Battery Data framework.
Step |
What You Did |
|---|---|
Load raw data |
Imported time-series data from a cycler-generated |
Clean & transform |
Renamed fields, standardized units, and computed missing information |
Align with BDF |
Applied best practices from the Battery Data Format, including column naming |
Generate timestamps |
Converted human-readable dates to Unix time in seconds (UTC) |
Visualize data |
Plotted voltage, current, and temperature to assess data integrity |
Export cleaned dataset |
Serialized the result into a structured |
By following this workflow, your dataset is now:
Structured and machine-readable
Consistently labeled using SI and community standards
Ready for analysis, semantic metadata, and publication
This notebook gives you a practical and reusable pattern for preparing battery test data that can be confidently shared, understood, and reused by others.